Cycle Time Analysis gives dispatchers a new level of performance transparency to determine where problems are occurring in the field and correct them in real-time. This article will help you access, understand, and get the most out of Cycle Time Analysis.
Table of Contents
Click a bullet below to jump to that section. Return to the top of this article by clicking Return to the top ⤴ at the end of each section.
- What is Cycle Time?
- Accessing Cycle Time Analysis
- Interpreting Cycle Time Analysis
- Trucker Cycle Report
- Tips, best practices, and FAQs
What is Cycle Time?
Cycle Time Analysis allows dispatchers to measure and manage turnaround time at the plant, the trucker's journey, and turnaround time at the job site. Understanding cycle time can help:
- identify where bottlenecks are occurring before they become problematic and spread
- determine if you are "over- or under-trucked", and make adjustments to improve dispatch order efficiency and throughput
- identify high-performing plants, truckers, and job sites to create best practices
- schedule and dispatch smarter
Accessing Cycle Time Analysis
Because it's located right from within the Open Dispatch Orders tab, Cycle Time Analysis allows dispatchers to identify AND address potential issues seamlessly from within their typical workflow.

Cycle Analysis button
Click the CYCLE ANALYSIS button to change from viewing dispatch order progress (above) to viewing the Full Cycle Time of each dispatch order (below).

The Full Cycle Time for a dispatch order
Click the “+” icon on a dispatch order to expand the order and see the Full Cycle Time of each assignment on the order.

Assignment cycle time
Click the right-facing arrow (caret) to expand the screen and the left-facing arrow to collapse.

Expand or collapse the Cycle Analysis screen
This reveals all four Cycle Analysis columns/metrics.
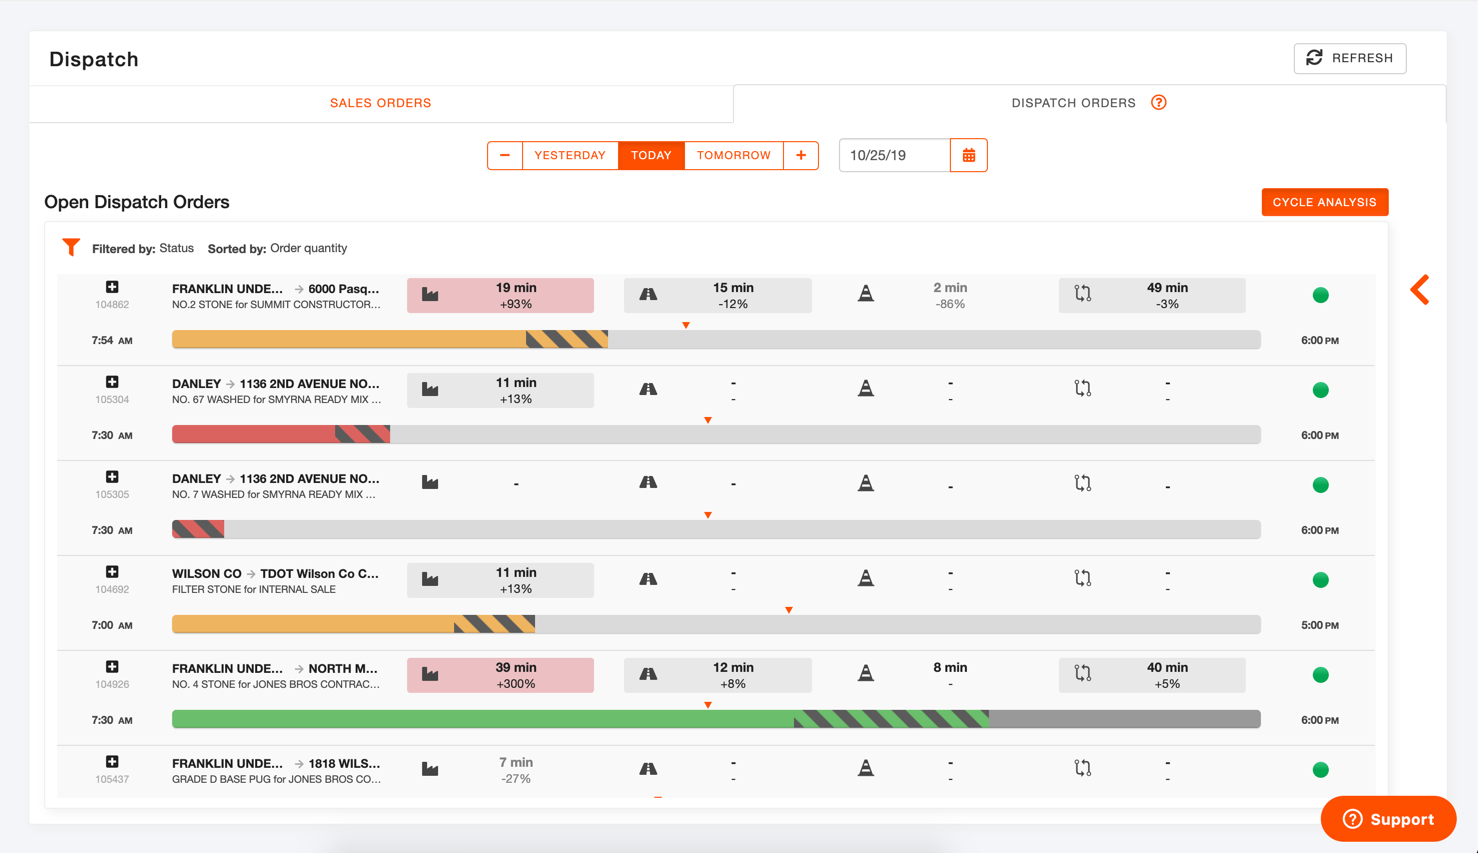
Full Cycle Analysis screen
Interpreting a Cycle Time Analysis
Cycle Time Analysis captures six points of data for each load associated with a dispatch order.
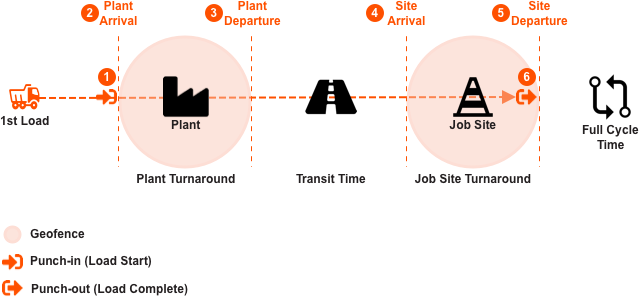
These six data elements combine to measure the efficiency of a load, an assignment, and a dispatch order (turnaround time).
- Plant turnaround. The average of all load pick-up times on an order/assignment
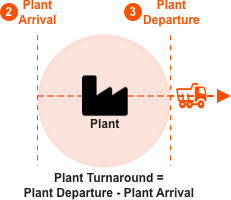
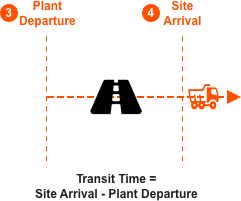
- Transit time. The average of all transit times for all loads on an order/assignment
- Site turnaround. The average of all drop off turnaround times for all loads on an order/assignment
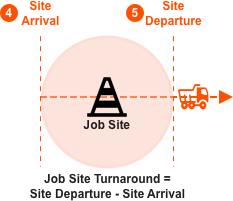
- Full Cycle Time. The average of time spent on a load - load start to load complete, for all loads on an order/assignment.

Comparison Values and Shading
We use shading and percentages to compare and highlight cycle time performance.
Percentage Differences Calculation
- Plant turnaround - Percentage value compared to the set turnaround time for each plant (currently defaulted to 10 minutes).
- Transit time - Percentage value compared to the expected travel time (according to Google Maps) at the start of the assignment.
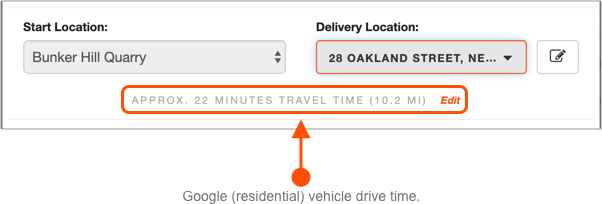
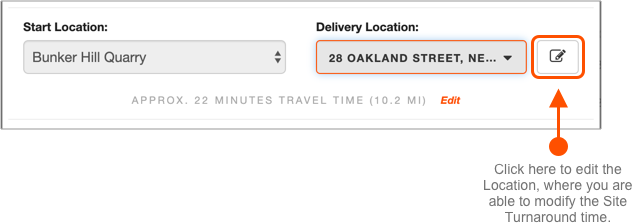
- Site turnaround - Percentage value compared to the delivery location turnaround time that is specified for each delivery location. The site turnaround time is set when you create a Delivery Location.

You can edit the site turnaround time for a delivery location when you create a dispatch order.
- Full Cycle Time - Percentage value is the actual time compared to the expected time which is plant turnaround (10 min), site turnaround (set in delivery location), expected transit time from plant to job site (traffic adjusted time captured when the load is started) and full cycle time (traffic adjusted time captured when the load is started from the hauler's current location to complete their load).

Shading
Shading is based on the variance for each metric between the expected time and the actual time. There are 3 levels of variances below.
- red - times that are taking more than 20% longer than expected
- gray - times that are within +/-20% of expected
- light gray - times that are more than 20% faster than the time expected

Trucker Cycle Report
You can view a Cycle Time Report for an individual trucker by clicking on the shortcut menu (1) for an individual assignment and selecting Cycle Report (2).

You can access this report for any in-progress or completed assignments.

Exporting a Trucker Cycle Report
You can export a Cycle Time Report for an individual trucker by clicking the EXPORT button. This will automatically download a .csv file with the contents shown above.
Tips, Best Practices, and FAQs
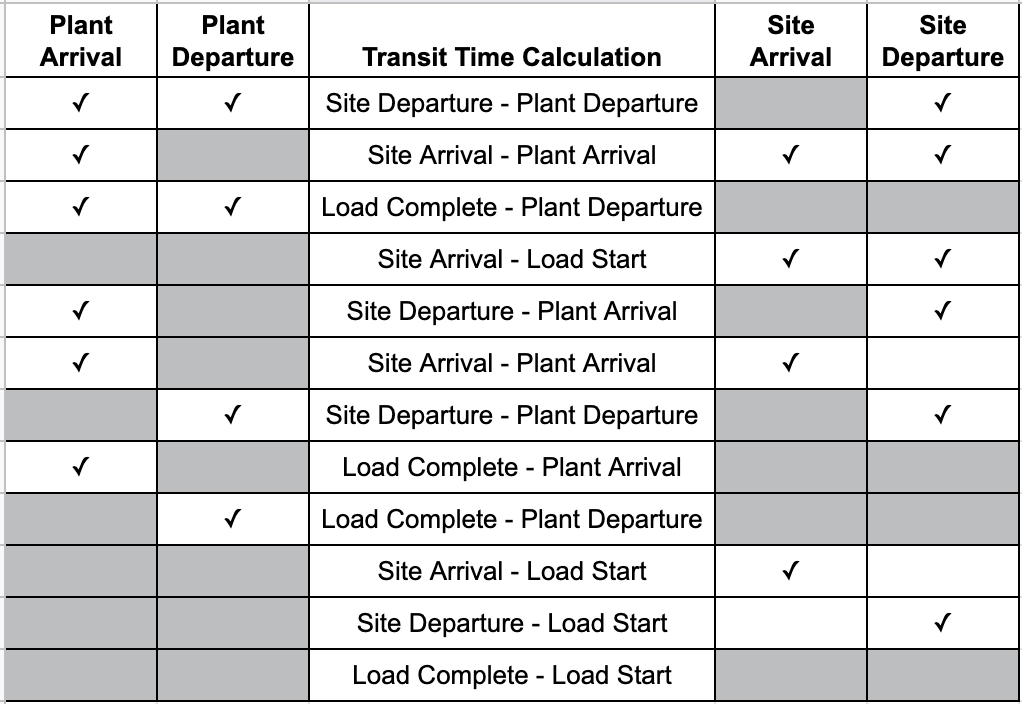
How do we calculate Transit Time when missing geofence entry and/or exit points?
In the ideal scenario, all data points are available to calculate cycle time. Unfortunately, that's not always the case. We make the following adjustments to calculations when missing geofence enter and exit events:
How can I edit a plant/job site geofence?
Cycle Time accuracy can be impacted by geofence accuracy. You can view, set, and/or edit a geofence from the LOCATION page.
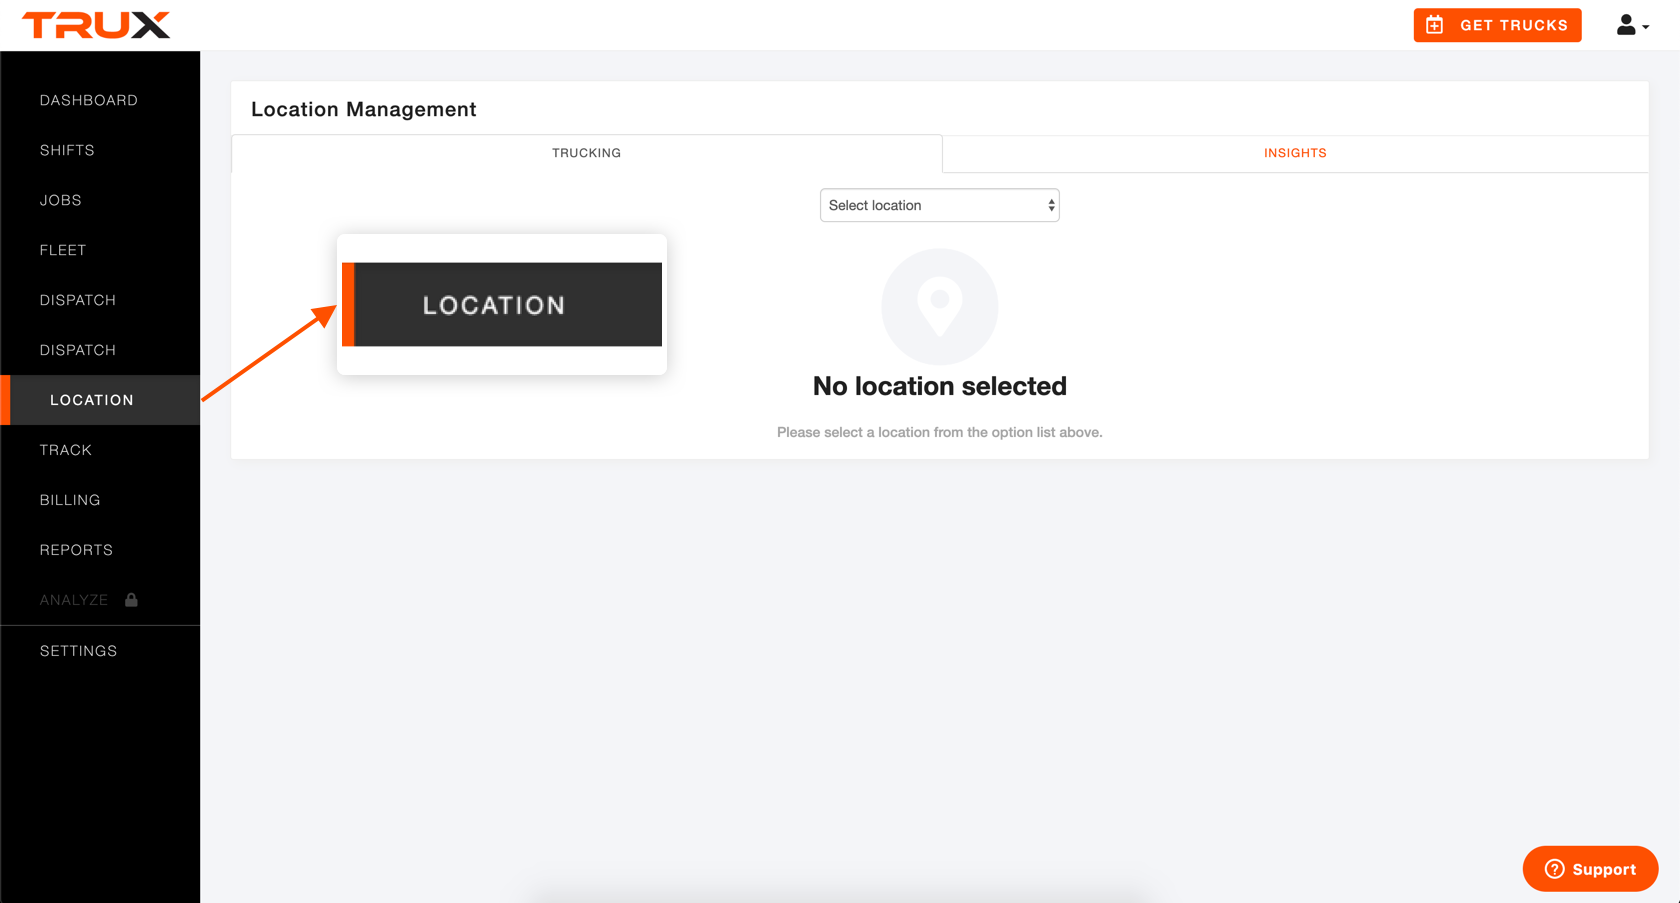
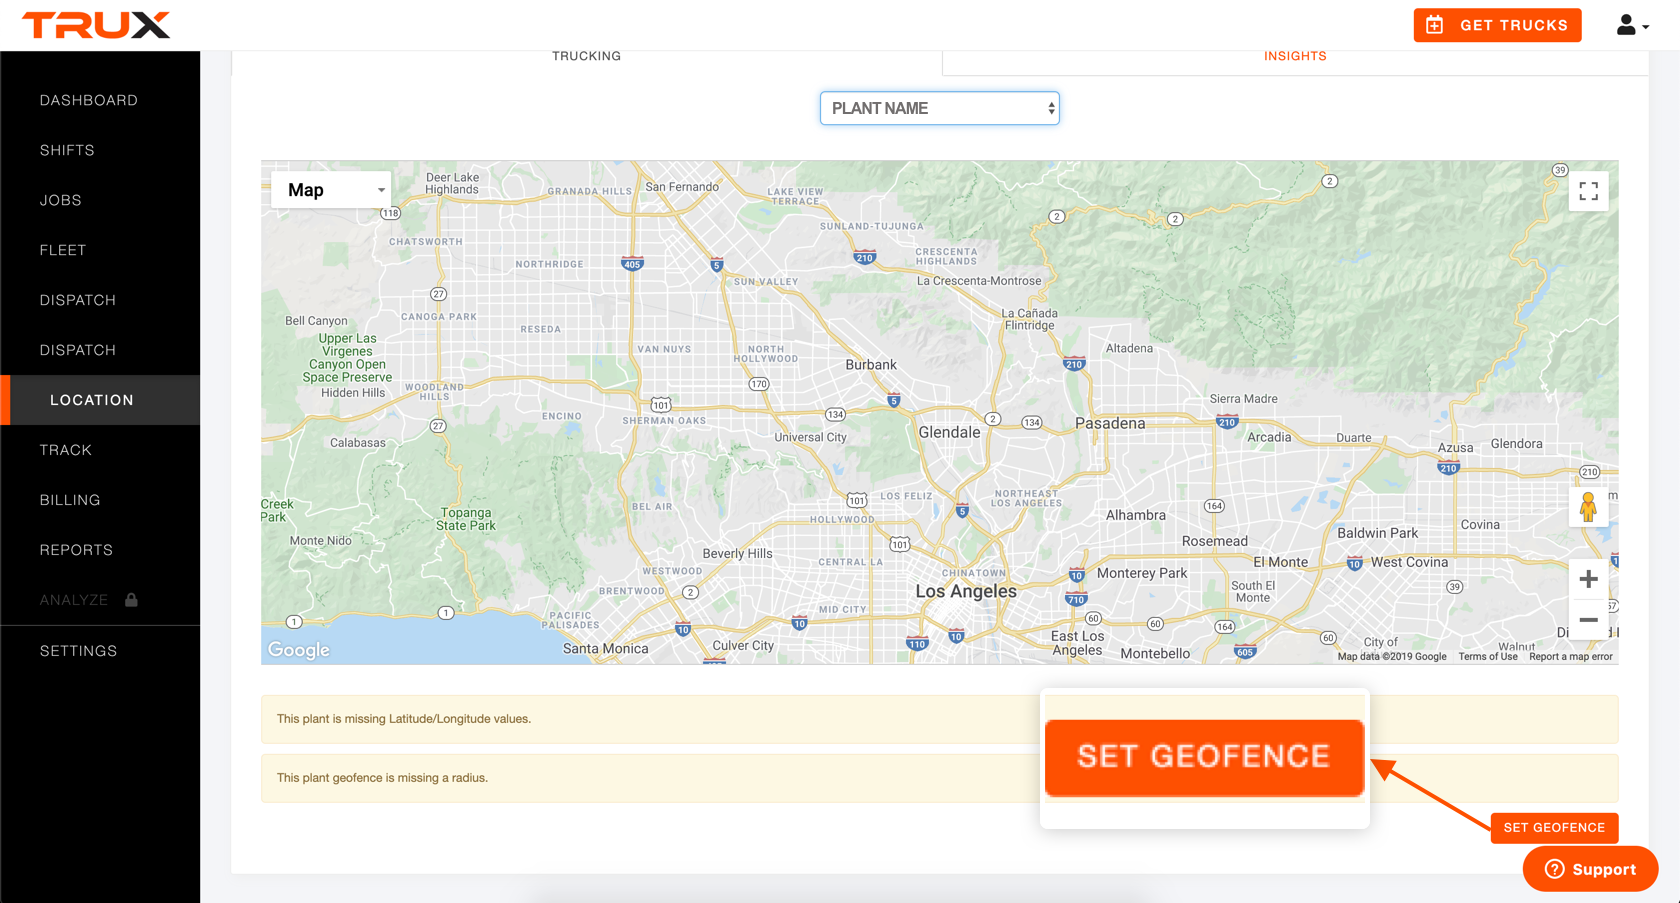
Select a Plant/Job Site location from the drop-down menu. If there is no geofence or radius set for the selected location, click SET GEOFENCE.
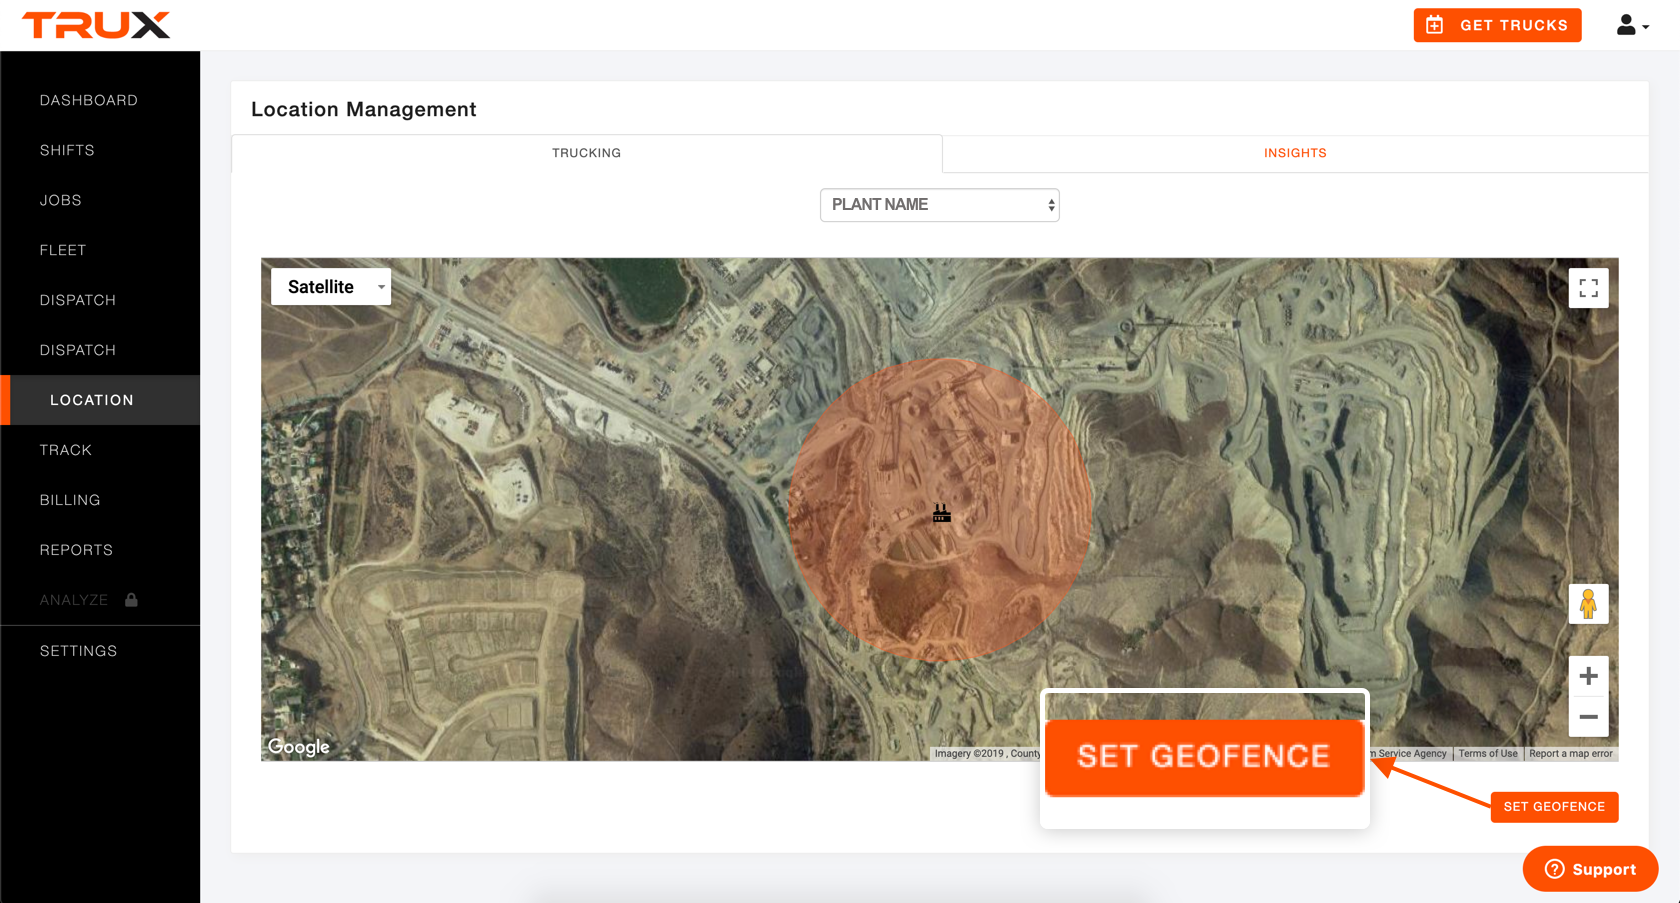
If there is a geofence set, but you would like to edit it, click SET GEOFENCE. You can change from Map to Satellite view to get a better look at the terrain.
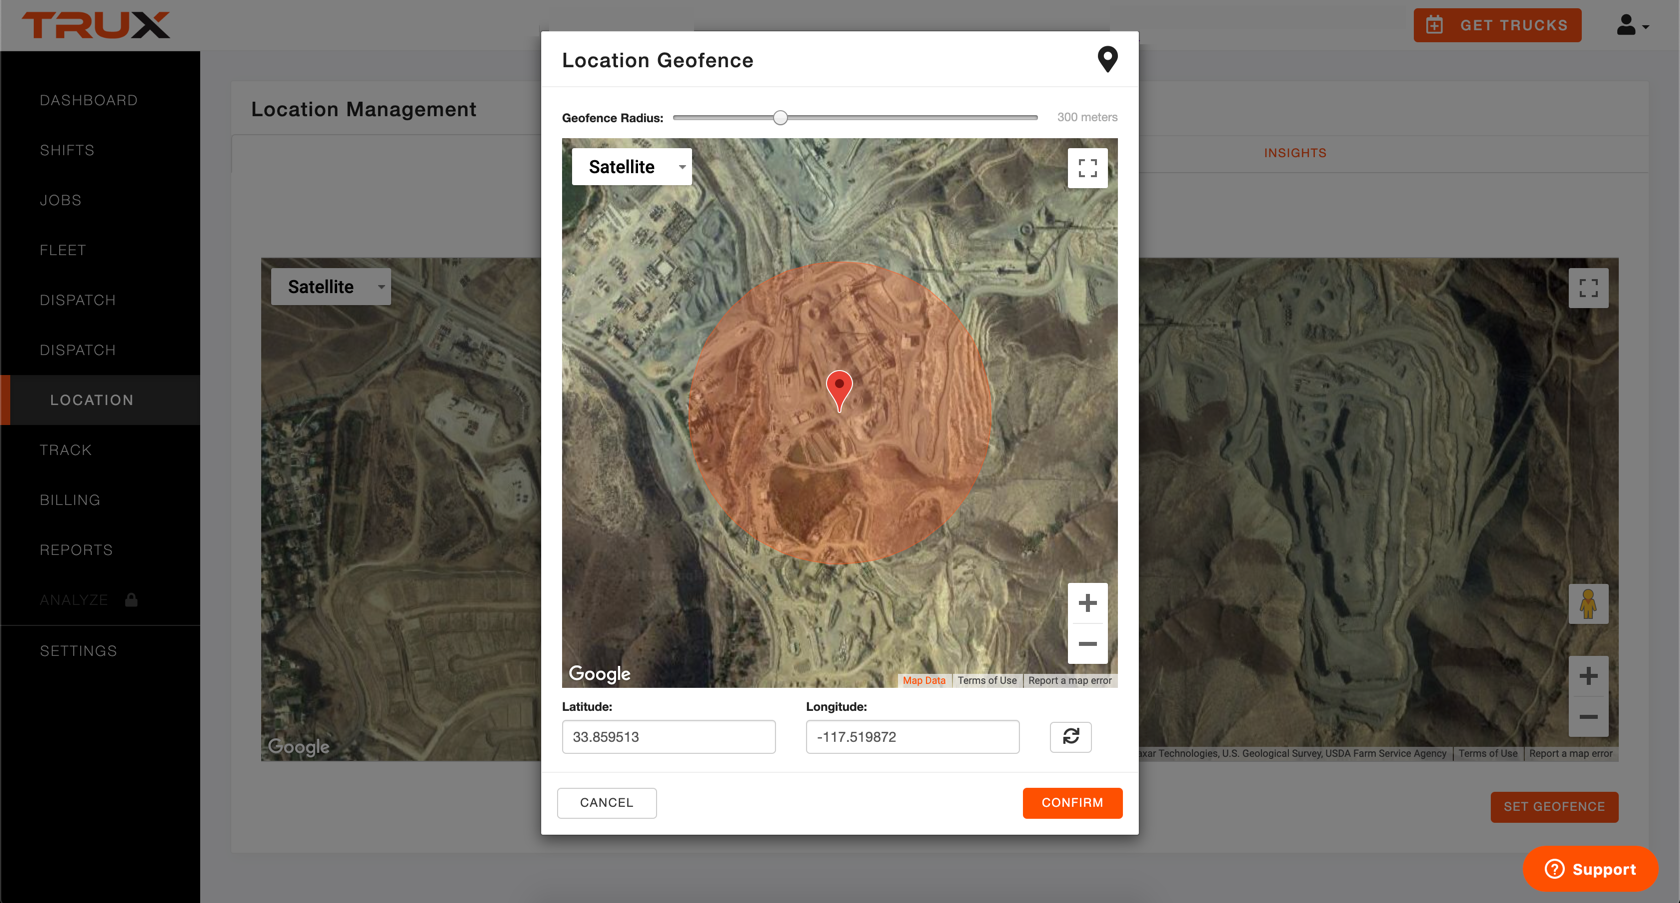
You can click and drag the map pin to change the latitude/longitude of your geofence, or you can enter specific latitude/longitude coordinates. Click and drag the Geofence Radius slider to increase/decrease the radius. When done, click CONFIRM to save the updated geofence settings.
Why do I have missing cycle times for some haulers?
- Confirm that you hauler(s) have punched in at the beginning of the day. You can scan the Active hauler list on the Dispatch Orders screen to see the status of each active hauler. Look for any that are no In Progress or Complete. If you see any of haven't punched in, you can message them from the Shifts page (find the shift, click the Shift Actions Menu, select Message).
- Confirm the hauler is on the latest version of the TRUX mobile app (Apple or Android).
Why are some hauler's turnaround times significantly higher than others on the same job?
- Compare the routes your haulers are taking to/from the plant/job site. From the Track page, select a plant from the Filter by Plant drop-down menu to view all haulers going to/coming from that location.
Why do I have missing cycle times for some plants/job sites?
- The turnaround time for a plant/job site is dependant on a hauler crossing into and exiting out of a geofence.
- Confirm that the geofence for the plant/job site is set correctly. You can make edits by following the instructions above.
- You can review some geofence best practices in this article.
Why is Plant/Job Site Turnaround very high for some haulers?
- Confirm that the hauler(s) are completing each load in the TRUX mobile app, in real-time.

Comments
0 comments
Please sign in to leave a comment.